1048158_10151433719166507_1140677261_o
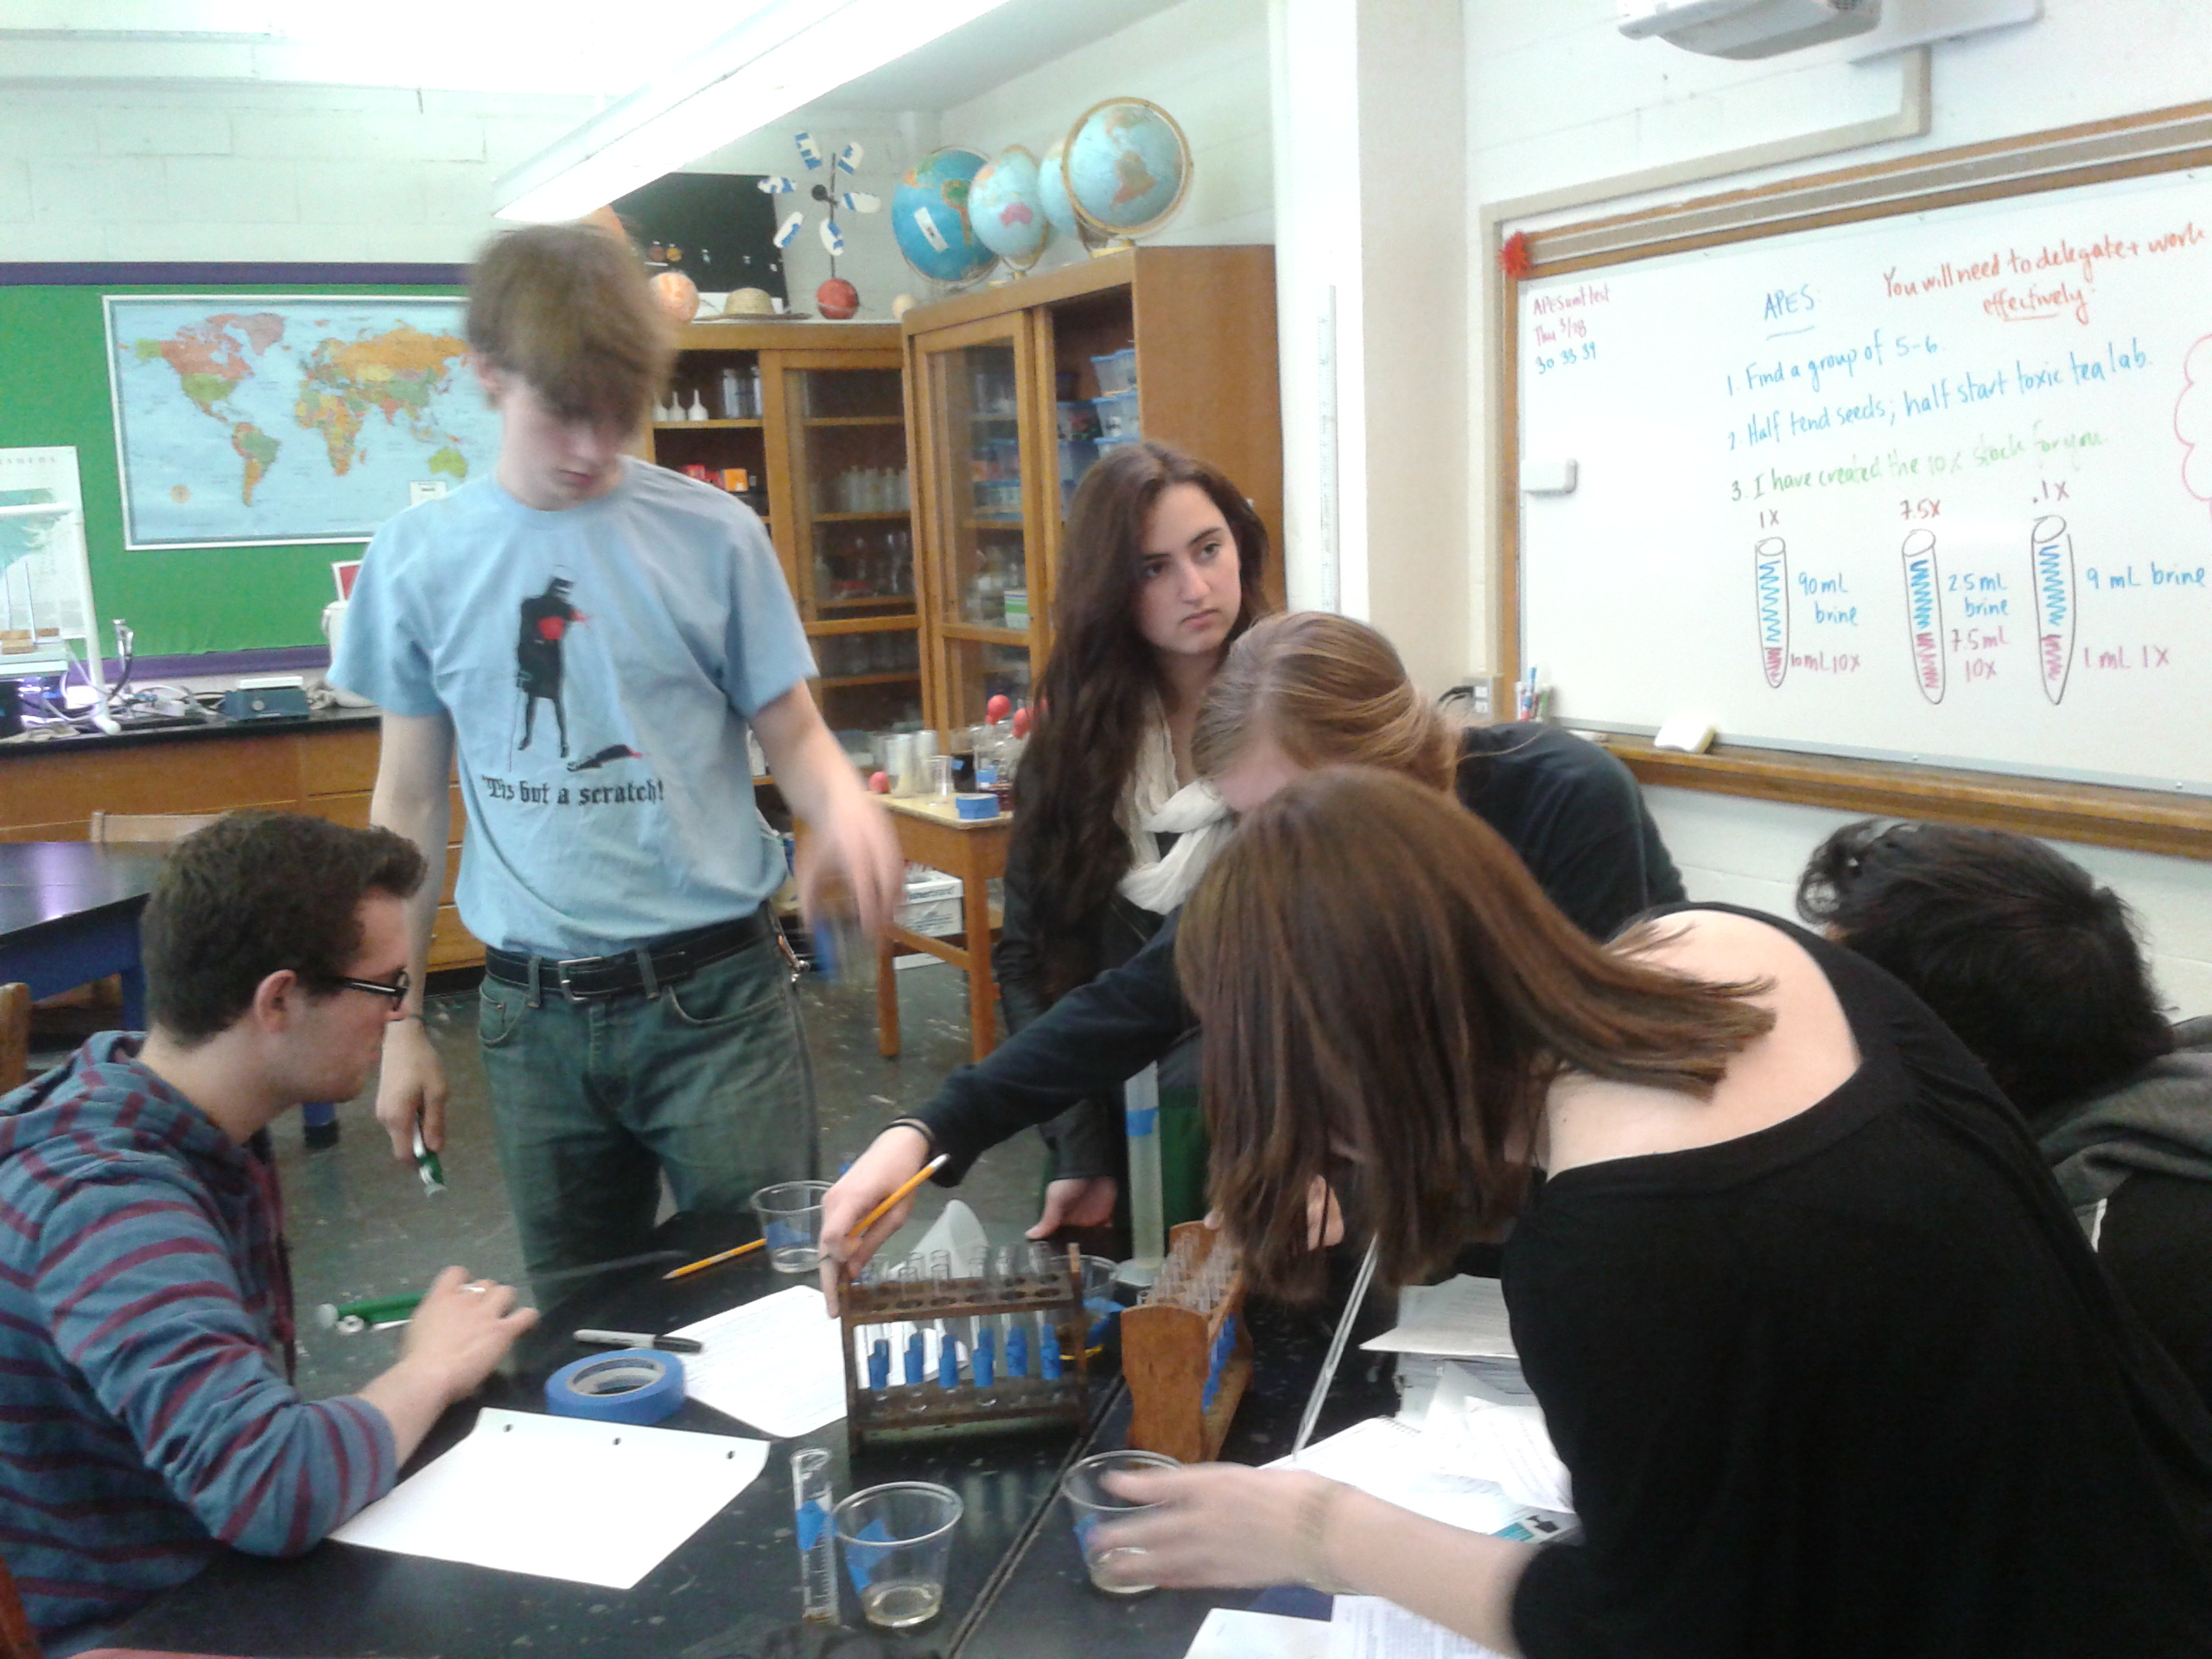
I have used the tablet to take pictures of what happens in my classroom, but it is not powerful enough to create graphs from data sets that are large enough for what I am teaching the kids about climate change. I’ve been able to do some reading and writing on the tablet for my lesson and unit plan, too!

I’ve attached some pictures of labs in my classroom, taken with the Lenovo tablet. Well, one is of pitcher plants in Culowhee and the others are of my APEnvironmental Students doing an LD50 Lab in class. 5th period LD50

Lesson implementation

I am beginning to think this project is never going to happen…when I originally planned this project within the AP Environmental curriculum, the government shut down and we couldn’t access the websites the students needed for data collection.

Now, we were supposed to do the lesson this week. We had a test for the previous unit on Monday instead of Friday because of the shortened day last week, we had 15 minute periods on Tuesday…two “snow” days…and who knows if there will be a delay tomorrow? Sigh.

I’ll get there. Just not yet. I’m looking forward to it!

Mentor partnership

What does the mentor partnership mean to me? This has been an invaluable experience for me professionally. A truly gifted mathematician, who is interested in the subject matter I teach, volunteered his time to help me develop material relevant to my students. How do you quantify that? I’m not sure I can.

I haven’t had a chance to teach my lessons because of the government’s debacle, but I will do it as soon as I can in the spring under another unit plan. (I teach atmosphere in the fall and air pollution in the spring, so the lessons will fit under the auspices of air pollution.) Getting feedback on the way I teach math in the science classroom has made me feel more comfortable with teaching statistics in general as they relate to the AP Environmental curriculum.

I think this experience with developing lessons with another, higher-level academic has changed the way I think about developing lessons. It has forced me to think more clearly about what I want to teach in a unit plan and why I want to teach it. I’m not sure that we get enough chances to do this as teachers driven by tests.

I know I am more knowledgable about statistics in general. I have been reading more data about education worldwide with a more critical eye.

Thanks, Richard.

Professional development, meaning

Each of these sessions was very different.

Our meeting at NCCAT was about using technology in the classroom and how to best maximize students’ use of technology time. I made some great plans and had some wonderful ideas. And we were supposed to get new technology this year, but the district changed its mind at the last minute. Luckily, we received some training about writing grants, so that’s what I’ll be doing to make up for the lack of computers in my school.

The last PD opportunity was much more political. I made some interesting connections and look forward to doing what I can do to move the teaching profession forward in this climate. It was heartwrenching to hear from and about teachers and our frozen pay and to hear about how so many teachers, even Kenans in the room, are considering their options to move to other states or get out of the teaching business. But I understand. I am in the same situations, none of them of my own design.

This fellowship has already led to many other opportunities. I’ve made connections with people and with ideas that shape what I’m doing within my classroom and without. I’ve not felt the presence of an ineffectual government quite so closely as I have in this fellowship. I wasn’t able to use my developed curriculum yet in the classroom because of its requirement of government collected and run data sets. I’ve listened to two sides of the debate skirt the issue of education. No one wants to talk about what’s really wrong in education. The Education Minister of Finland has it right: the US does not have an education problem, we have a poverty problem.

I’m not from North Carolina. I grew up and lived in New England most of my life. My home state of Maine values education in a different way than this state seems to value it. So this experience of being mentored, of being paid to develop and use contemporary, valuable curriculum, of being treated as a professional by other professionals comes at a strange time in the educational history of this state. I’m being told how valued I am by the Kenan Fellowship (and I believe I am) at the same time being told how undervalued I am by the state that pays my meager salary and wants to pit me against all other teachers, to vie for students, schools, curriculum, access to technology, and other necessary agents for success in the new, capitalism-gone-mad world of public education.

I don’t mean to be a whiner. I know other people in the world have much worse circumstances that I do. But it seems that valuing public education is the best venue for making those worse circumstances go away.

Something learned

I am more organized this year because of Evernote…and other things.

I think the process of having to plan a unit from scratch to meet Kenan and AP requirements has changed the way I think about unit planning. I’ve been more inclined to find the most contemporary readings I can find for my students.

Working with a trained statistician has made me examine my biases within my subject matter and look for the most evenly argued points of view to share with students.

I receive Scientific American at home…and they have an entire section dedicated to food this month. There’s an awesome article about bioengineered foods, something I have some serious ethical concerns about…and since my Kenan experience, I was really attracted to one article as an assignment for my students…that gives a really even assessment of the sides of the debate.

Experience and how it impacts my students

I think this is a very simple question for me. Bar none, the most controversial topic I teach is climate change. Students have the most questions, the greatest amount of confusion, and a large amount of misinformation. This summer, I’ve been able to research where some of the confusion and misunderstanding comes from as well as who authors the misinformation. It’s not often in life that you are paid to research something so thoroughly. So, the unit plan I am writing (and it’s almost done!) may not in all ways reflect the research I’ve completed, but I know my teaching of this subject will. I believe that with the help of my mentor, I’ve been able to construct a lesson plan that teaches a broad range of information about climate and weather, the application of basic statistical principles in science (in general) and about meteorology (specifically), and allows students to draw their own, better informed conclusions. That’s the kind of teacher I’d like to be all the time.

Biggest A-Ha Moment

I wish I could have filmed my recent trip to the National Climate Data Center in Asheville. I met with four scientists with differing specialties: ocean currents, meteorology, quality control, and educational outreach. The conversations did not at all go in the direction I thought they might. We talked some about the normalization of data, how, for example, data is adjusted to consider the amount of impermeable surface or albedo at a collection site. One of the things I had not thought about is that most data collection sites are airports. Airports are usually built in a relatively rural area (think RDU…) and the cities and towns grow up around them and thus change the baseline for temperature data. So good climatologists have to adjust these data over time in an accurate way. So that’s one of the things that often comes into the discussion when climate change is questioned. How accurate are the models we use to adjust these values? (Pretty darned accurate, actually…)

I think the funniest comment was that climatologists are often accused of being in a giant conspiracy to bilk world-wide governments out of money. One of the scientists grumbled that “three people can’t even keep a conspiracy quiet. How would the entire world-wide community?”

The biggest A-Ha moment may not seem like much, but it really is, in the climate change “debate.” Weather reporting in the US and worldwide are biased toward what happens on the east coast…because that’s where Washington DC is. Having recently spent some time in the midwest, this is totally true. So anytime the weather in Virginia doesn’t quite adhere to a suggested or assumed trend, we hear all about it. (I was in Europe in December and only remember reporting on Virginia’s weather while we were there!)

We talked about how to talk to my students about bias in statistics on blogs and elsewhere. And we pretty much decided that the “Skeptical Science” site from Australia is pretty darn good!

Well worth the drive…

Technology and the Common Core

When I first started teaching, I had a long conversation with my parents. Both of them taught for long, successful careers. I talked about the new challenges for getting kids through school, ready for college: computer literacy and modern pressures to excel. The crux of the conversation was that the overall expectations for students are the same as they were when I was in high school. You need to be able to write well, do at least applied simple mathematical and graphing functions, and think about what you’re arguing and why.

Common core has less required information, at least in the science disciplines that I teach. Some of the required curriculum is enhanced by the use of technology: it’s easier to see Milankovitch cycles using an animation model rather than using physical models with globes, etc. The cycles are very long and precession and nutation are slight compared to the scale of the universe. (Milankovitch cycles are more or less new to the Earth Science curriculum.)

It’s easier for students to get sidetracked by technology and miss the important message or significant skill taught in a lesson. There’s so much available information on the internet. It’s so much easier for students to find poor-quality information. So teaching critical thinking can be really challenging in the modern world.

Summer Internship and Curriculum

The unit plan I am authoring for Kenan includes background information about climate change, specifically from professionals researching and using climate information; the use of statistics in climate science and some reasons why climate statistics and interpretation are sometimes considered controversial in the lay community; an understanding of line of best fit and the concept of regression; hand calculations of the value of r2 as a measurement of the relationship between values in a data set; use of statistical freeware such as R; using public databases to cull relevant climate data; correctly extrapolating and interpolating values on a graph using r2.

My summer internship requires that I work with two statisticians from SAMSI to teach an aspect of climate change in the classroom and how statisticians make decisions using data. My kids get distracted by outliers and incongruent examples. I hope to use regression to demonstrate how to better understand the meaning of datasets.

Challenges Leveraging Technology

We’re supposed to be honest. I will be as honest as I can about this…

DSA’s science department has a set of laptops that were purchased when DSA was formed…in 1995. We’ve kept them going for word processing, general (basic) web research, and email. We’ve increased their RAM as much as we can and removed all of the superfluous software that we can so we can get some use out of them. They will barely run LoggerPro with our Vernier probes. It’s that bad. I/we do what we can. I will take the students to one of the computer labs to use newer machines when it’s appropriate, but much of the time, we need to be in a science classroom to do the activity that computer access could enhance!

We have a technology fund this year, so we should get at least one laptop cart for the department…if not two. I’ve only ever taught for DSA, so this is a hard question to answer. I’ve only been able to teach kids to create graphs in Excel and do very simple computer operations. Sigh. I can’t require a lot of computer use from my students at home because, even though they have access to newer computers in our labs and our media center, they might not have access at home.

So. I have no idea. I great deal of my fellowship relies upon my ability to teach students how to use statistical software, R. Can I answer this one during the school year?