When I started observing the manufacturing processes in the GE Aviation Rotating Parts plant I was awestruck by the amount of raw material, manpower, machines, and processes all happening at the same time. Then I reflected on the fact that this operation runs 24 hours per day for about 360 days of the year. The amount of data that is collected and organized from all of the various operations in the path of a manufactured part is astronomical.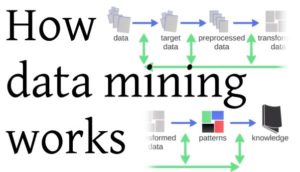
A typical machined part may go through as many as 25 separate operations during the manufacturing process. At each step in the process, operators are taking measurements to ensure the part is meeting specific tolerances. Along the way quality engineers are monitoring any nonconforming measurements and creating an analysis to help determine why the part is nonconforming, and how it can be fixed.
When I sat with the quality engineering team I have to admit I was impressed by the number of objective data points they could pull from. Still making meaning from that data is not an easy task. The part that we were researching was only about halfway through the manufacturing process and the quality analysis database was tracking over 100 measurement points.
 The use of data mining techniques in manufacturing began in the 1990s and it has gradually progressed to become a mainstream part of manufacturing. Data mining is now used in many different areas in manufacturing engineering to extract knowledge for use in maintenance, nonconformance, design, process tracking, quality assurance, scheduling, and decision support. Data can be analyzed to identify hidden patterns in the parameters that control manufacturing processes or to determine and improve the quality of products.
A major advantage of data mining is that the required data for analysis can be collected during the normal operations of the manufacturing process being studied. So it is not necessary to introduce a separate dedicated process for data collection, data can easily be collected and tracked while the process is being completed. Thus, hundreds, and possibly thousands of distinct data points can be gathered at no extra cost, and with very little extra effort by the machine operators.
In the example, the part being analyzed was measuring out of conformance at a particular radius and at a specific point in the machining process. By analyzing that data the quality engineers were able to construct a new cutting path that corrected the problem and brought the number of nonconforming measurements down later in the manufacturing process. This is the Monitor, Analyze, and Improve portion of the DMAIC process discussed earlier.
Now, in our world of education, the data collection process is not so neat and orderly. We clearly have a multitude of opportunities to collect data and build a data profile of students. But just as in the quality engineering process, making meaning from the data and using the data to guide decision making is harder than it sounds. In addition, within the realm of education, our data is not as clear, straightforward, or objective. Even with those issues, there are many things we can learn and apply from the DMAIC model used in manufacturing.
Clearly, our students are not manufactured parts flowing through an assembly line. However, our ability to capture useful data and apply it in a process of quality improvement is vital to our student’s long term success. How do we create a useful picture from data that we can gather easily? How do we know if the data is a reflection of the educator or the needs of the student? What kind of data will ensure that we can provide effective analysis and monitoring of student progress?
In her book Weapons of Math Destruction: How Big Data Increases Inequality and Threatens Democracy, Cathy O’neil points out “We’ve seen time and again that mathematical models can sift through data to locate people who are likely to face great challenges, whether from crime, poverty, or education. It’s up to society whether to use that intelligence to reject and punish them—or to reach out to them with the resources they need. We can use the scale and efficiency that make WMDs so pernicious in order to help people. It all depends on the objective we choose.”
If the objective is quality improvement, and providing better resources for our students, it seems we have the tools we need to put data to work in a positive and sustainable manner. To be an effective educator, I want to learn how to find the best sources of useful data, how to better utilize my data analysis and quality improvement, and how to implement solutions that can be maintained and evaluated over time. I want to use data “to reach out” to my students by gaining a better understanding of where they are and how to keep them headed in the right direction.