Activity 1: Lab: Downstream Biomanufacturing and Cell Separation
Materials Needed
|
Simulating Cell Separation in the Downstream Biomanufacturing Process Equipment and materials for students
|
| Equipment and notes |
Quantity per group (recommend 2-4) |
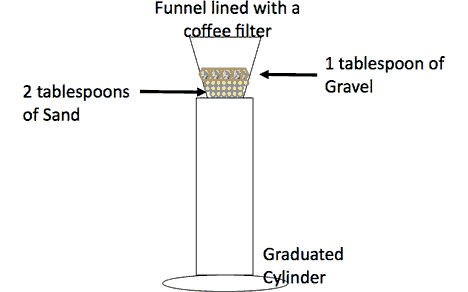
| □ 100 mL Graduated Cylinder |
1 |
| □ 10 mL Graduated Cylinder |
1 |
| □ Funnel |
1 |
| □ Coffee filter |
1 |
| □ Gravel |
1 tablespoon |
| □ Sand |
2 tablespoons |
| □ Yeast broth |
25 mL |
| □ Flask with water |
100 mL |
| □ Small beaker (50 mL size) |
1 |
| □ Calculator |
1 |
|
Simulating Cell Separation in the Downstream Biomanufacturing Process Equipment and materials for instructor preparation
|
| Equipment and notes |
Quantity |
| □ Red food coloring |
5 drops per group plus 15 drops for standard curve comparison |
| □ Water |
20 mL per group |
| □ Test Tube Rack |
1 |
| □ Test Tubes or plastic cups |
6 |
| □ Pipette (10 or 20 mL) |
1 |
| □ Pipette Pump (10 or 20 mL) |
1 |
| □ Lab Tape |
2 inches |
| □ Water (in a flask or beaker) |
40 mL |
| □ Disposable Pipette or Micropipette |
1 |
Preparation Instructions
- In order to simulate “product recovery” red food coloring will be added to the yeast broth from the bioreactors. The red food coloring will be our “product.”
- Each student group will need a sample that is made of the following ingredients:
- 25 mL of yeast broth (You can use the remains from bioreactor from previous experiment or make a fresh batch.)
- 5 drops of red food coloring
- The teacher can make a large batch of broth by multiplying the number of student groups, times the amounts listed above. The sample can be distributed to groups in a small cup or beaker.
- Groups will assemble a filtration apparatus using the equipment in the student list. The broth will drain through the apparatus in less than five minutes.
- In order to create more variables within the experiment, the teacher can assign different filtration designs to different groups. For example: coffee filters only, coffee filters and gravel, coffee filters and sand, coffee filters and sand and gravel.
- Students will collect data on the filtration rate for their design; make notes on the appearance and amount of filtrate and the appearance of the filters. In addition, the students will compare the color of their filtrate to a “standard curve” to determine the level of concentration or amount of “product” that has been recovered.
- Next, students should be directed to use 10 mL of water to “wash” away any additional “product” that is trapped in the filter. Students will then need to record the new volume collected after the “wash” is complete. Students should repeat the “wash” process two more times. After each step, they should fill in the data on the chart.
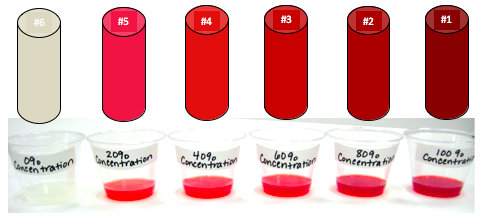
- The teacher will set up a “standard curve” for students to compare their filtrate samples to. Set up the test tube rack with six test tubes. As an alternative to test tubes, the teacher could also prepare the samples in small, clear plastic cups or glasses. The level of product concentration will be calculated based on comparing the color of the filtrate to the color of the “standard curve” test tubes.
- Test Tube #1: 5 drops of red food coloring in 25 ml yeast broth (100% concentration)
- Test Tube #2: 4 drops of red food coloring in 25 ml yeast broth (80% concentration)
- Test Tube #3: 3 drops of red food coloring in 25 ml yeast broth (60% concentration)
- Test Tube #4: 2 drops of red food coloring in 25 ml of yeast broth (40% concentration)
- Test Tube #5: 1 drops of red food coloring in 25 ml yeast broth (20% concentration)
- Test Tube #6: o drops of red food coloring in 25 ml yeast broth (0% concentration)
The apparatus should be assembled as shown below:
Example of Standard Curve Set Up:
NOTE: The teacher may need to set up several standard curve samples and have them available for student viewing in various parts of the classroom. As an extension activity, the teacher could have each group set up their own set of standard curve test tubes/cups.
Laboratory Analysis/Assessment
- In order for the class to see the results of all the groups, the teacher will need to create a large chart or make an overhead that will be made visible to the class. Students can compare and contrast the results and answer the analysis questions on their answer sheet by observing the data on the chart.
Sample chart: (Note- the teacher will need to adjust based on the number of groups in the class.)
|
Parameter
|
Group 1
|
Group 2
|
Group 3
|
Group 4
|
|
Filter Medium
|
|
|
|
|
|
Filtrate collected
|
|
|
|
|
|
Filtration rate
|
|
|
|
|
|
Final volume
|
|
|
|
|
|
Final Concentration
|
|
|
|
|
|
Any color on media?
|
|
|
|
|
|
% Yield
|
|
|
|
|
- The trend of the data will most likely be that the percent yield steadily increases after each wash. Despite the fact the filtrate has water added to it due to the “wash,” the additional product that is recovered during the wash maintains the concentration percentage and therefore creates a higher yield.
Critical Vocabulary
- Downstream Biomanufacturing
- Extracellular
- Cell Separation
- Filtration Apparatus
- Quality Control
- Yield Percentage
- Standard Curve
- Concentration Percentage