
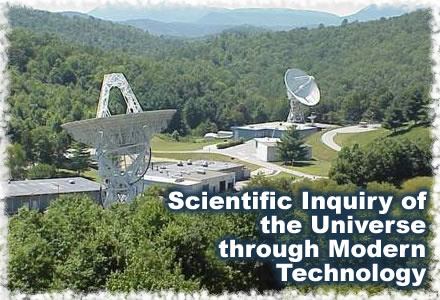
Scientific Inquiry of the Universe through Modern Technology
| Author: | Derek Dennis |
| Level: | Middle School |
| Content Area: | Science |
| Author: | Derek Dennis |
| Level: | Middle School |
| Content Area: | Science |
In this lab, students will measure and compare the peak intensity of 21 cm radio waves emitted from the gas and dust between five different objects.
PARIPod 3.1 is still in development.
On earth and in space we are immersed in a sea of electromagnetic waves. Electromagnetic waves include gamma rays (very high energy light), X-rays (high energy light), ultraviolet rays (light that gives us tans), visible light (light we can see with our eyes), infrared light (light that we sense as heat), microwaves (light we use in our microwaves), and finally radio waves (light we listen to on the radio and on our cell phones). Almost everything emits, reflects and absorbs electromagnetic waves. For more information on electromagnetic waves see Lab 2. In this lab we will focus on nebula or clouds of dust and gas found between stars.
If you go outside with a pair of binoculars and look into the constellation of Orion, you will see more than stars. If you look close enough, you will see a cloud of gas and dust. We call this the Orion Nebula. The Orion Nebula is made mostly of hydrogen gas. In fact 70% of our observable universe is made of hydrogen gas. Consequently, the dominant source of radio waves, which we will be observing with Smiley, comes from hydrogen gas.
So how does hydrogen gas emit radio waves? Here’s the science: A neutral hydrogen atom consists of a proton surrounded by an electron. One property that both an electron and a proton have is something called spin. Through a crude analogy, spin can be thought of as a spinning earth orbiting a spinning Sun. If we picture spin as this rotation we can place a direction on spin. If the spin of the earth is up, then the earth is spinning counter clockwise as it orbits the sun. If the spin of the earth is down, then it is spinning clockwise as it orbits the sun. The same works for the sun. When the spins of an electron and proton are in the same direction, meaning they are both spinning in the same direction, then the spins are said to be parallel. When the spins of an electron and a proton are in different directions, meaning they are spinning in different directions, the spins are said to be antiparallel. When an electron and a proton have parallel spins, the electron is in a slightly higher energy level than when the electron and proton have anti- parallel spins. Nature always prefers to be in the lowest energy possible, so parallel spins usually decay into antiparallel spins. Hydrogen atoms in a nebula can collide or absorb light, cau sing the electron to flip from its natural state of being antiparallel to the proton to parallel to the spin of the proton. Since the electron wants to be in its lowest energy level it flips back to antiparallel. However, when the electron spin-flips it emits a radio wave with wavelength of 21 centimeters and a frequency of 1.42 Gigahertz (1 billion Hertz). Wavelength is simply the length of a cycle and frequency is the number of cycles per second. (See 3.1 for further discussion on wavelength and frequency.) Using Smiley, you will measure 21 cm radio waves from gas and dust that exists between the stars, emitted from the spin-flip transitions from hydrogen. These 21 cm radio waves measure slightly less than the width of an 8 1/2 x 11 sheet of paper. However, these radio waves are much longer than a visible electromagnetic wave (typically visible light has a wavelength of about 550 nanometers which is about 400,000 times smaller than our radio wave).
Address: Campus Box 7006. Raleigh, NC 27695 Telephone: 919.515.5118 Fax: 919.515.5831 E-Mail: KenanFellows@NCSU.edu