When I started observing the manufacturing processes in the GE Aviation Rotating Parts plant I was awestruck by the amount of raw material, manpower, machines, and processes all happening at the same time. Then I reflected on the fact that this operation runs 24 hours per day for about 360 days of the year. The amount of data that is collected and organized from all of the various operations in the path of a manufactured part is astronomical.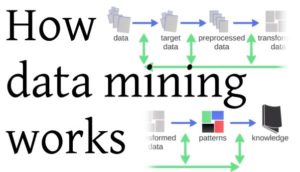
A typical machined part may go through as many as 25 separate operations during the manufacturing process. At each step in the process, operators are taking measurements to ensure the part is meeting specific tolerances. Along the way quality engineers are monitoring any nonconforming measurements and creating an analysis to help determine why the part is nonconforming, and how it can be fixed.
When I sat with the quality engineering team I have to admit I was impressed by the number of objective data points they could pull from. Still making meaning from that data is not an easy task. The part that we were researching was only about halfway through the manufacturing process and the quality analysis database was tracking over 100 measurement points.
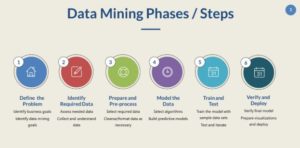 The use of data mining techniques in manufacturing began in the 1990s and it has gradually progressed to become a mainstream part of manufacturing. Data mining is now used in many different areas in manufacturing engineering to extract knowledge for use in maintenance, nonconformance, design, process tracking, quality assurance, scheduling, and decision support. Data can be analyzed to identify hidden patterns in the parameters that control manufacturing processes or to determine and improve the quality of products.
A major advantage of data mining is that the required data for analysis can be collected during the normal operations of the manufacturing process being studied. So it is not necessary to introduce a separate dedicated process for data collection, data can easily be collected and tracked while the process is being completed. Thus, hundreds, and possibly thousands of distinct data points can be gathered at no extra cost, and with very little extra effort by the machine operators.
In the example, the part being analyzed was measuring out of conformance at a particular radius and at a specific point in the machining process. By analyzing that data the quality engineers were able to construct a new cutting path that corrected the problem and brought the number of nonconforming measurements down later in the manufacturing process. This is the Monitor, Analyze, and Improve portion of the DMAIC process discussed earlier.
Now, in our world of education, the data collection process is not so neat and orderly. We clearly have a multitude of opportunities to collect data and build a data profile of students. But just as in the quality engineering process, making meaning from the data and using the data to guide decision making is harder than it sounds. In addition, within the realm of education, our data is not as clear, straightforward, or objective. Even with those issues, there are many things we can learn and apply from the DMAIC model used in manufacturing.
Clearly, our students are not manufactured parts flowing through an assembly line. However, our ability to capture useful data and apply it in a process of quality improvement is vital to our student’s long term success. How do we create a useful picture from data that we can gather easily? How do we know if the data is a reflection of the educator or the needs of the student? What kind of data will ensure that we can provide effective analysis and monitoring of student progress?
In her book Weapons of Math Destruction: How Big Data Increases Inequality and Threatens Democracy, Cathy O’neil points out “We’ve seen time and again that mathematical models can sift through data to locate people who are likely to face great challenges, whether from crime, poverty, or education. It’s up to society whether to use that intelligence to reject and punish them—or to reach out to them with the resources they need. We can use the scale and efficiency that make WMDs so pernicious in order to help people. It all depends on the objective we choose.”
If the objective is quality improvement, and providing better resources for our students, it seems we have the tools we need to put data to work in a positive and sustainable manner. To be an effective educator, I want to learn how to find the best sources of useful data, how to better utilize my data analysis and quality improvement, and how to implement solutions that can be maintained and evaluated over time. I want to use data “to reach out” to my students by gaining a better understanding of where they are and how to keep them headed in the right direction.
 Gemba is a Japanese term meaning “the real place.” Commonly used in Japan, the police could refer to a crime scene as gemba, and TV reporters often refer to themselves as reporting live from gemba.
 At the GE Aviation Rotating Parts facility, the leadership teams made up of production supervisors, process engineers, quality engineers, and plant-wide supervisors engage in a daily gemba walk.
 Over the course of a Gemba Walk, production supervisors, process engineers, quality engineers, and plant-wide supervisors are expected to simply observe and understand operation or process. As part of the Kaizen methodology, it is also supposed to encourage greater communication, transparency, and trust between the machine operators and leadership, all part of building a teaming culture. For this reason, it is not appropriate to use a Gemba walk to point out employee flaws or enforce policy, the purpose is to inspect and understand the operation or process.
 The goal or objective for the day may be productivity, cost efficiency, safety, or quality. In order to be as precise as possible, the teams prepare a list of questions they are going to focus on. The operators that will be observed are prepared for what is going to happen. All team members need to have a clear understanding that the Gemba walk is a common process where the final destination is continuous improvement. The leadership team wants the operators to feel comfortable and willing to collaborate.
 When I think about how the evaluation process roles out in our school, it makes me wonder if a daily gemba walk would be a useful exercise. The walk would have a different theme each day, maybe student behavior on Monday, technology use on Tuesday, Safety on Wednesday, PBIS on Thursday, and MTSS on Friday, all at different times of day to ensure that different classes and combinations of students are seen. The walk would not be an evaluation, but just fact-finding, and opportunity for the administration to interact with staff and students. After the walk, they could do some analysis and post thoughts and findings to a shared faculty resource page for discussion and feedback. I am just brainstorming, but after watching a gemba walk in this very complicated manufacturing environment it seems like a logical process for our school.
 Rotating parts facility has a three-part leadership team which includes a production supervisor who oversees the flow of operations and materials, a process engineer who works directly with the machine operators and the production supervisor to streamline the manufacturing operations and ensure the efficiency of the operations, and a quality engineer who oversees and manages the quality assurance process during the manufacturing operations.
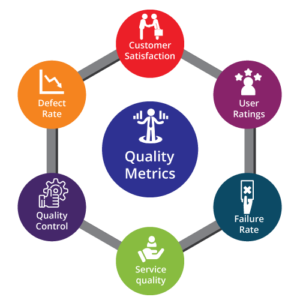
 The quality engineering operation is far from simple. Each cell is responsible for multiple parts and operations, and data is collected throughout the process to help track and fix any problems that may be emerging. The parts being manufactured in the plant go through up to 25 operations, and at each point, any small error can lead to a defect. In addition, the parts have complex cutting and milling operations that can contribute to accumulated stresses, and error tolerances can be very tight, less than 1/1000 of an inch in most cases. Finding where an error is happening, why, and how it is happening is not guesswork, it is an extremely detailed process that includes thousands of data points collected by the machines and operators throughout the process.
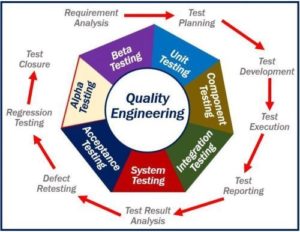 a day with Jon who oversees the quality lab. In the quality lab, the technicians are using a variety of techniques to essentially double check the data collected by the operators. Obviously, they cannot collect and analyze each and every part leaving the factory, so they do a statistical sampling and compare the values collected to what is being recorded in the internal QA database. I think my students would absolutely be fascinated with the lab because unlike the factory floor they have operational Programmable Logic Controllers or modified robotic arms that are testing tolerances on the parts in an automated fashion. The whole process has a very state of the art feel. At the same time, technicians are using a very analog process of placing a dental epoxy in certain small locations in the part to create a mold that can then be measured with digital and analog tools. Due to the high reflectivity of the metals used in the parts some state of the art measuring devices that depend on lasers and ultrasound are not as reliable as is needed in this very specific environment. It is an interesting combination of older and brand new technologies. It also has a very real outcome, as these parts are heading for engines that power the planes that fly all over our planet. A slip in quality is just not acceptable.
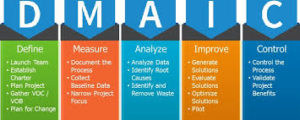 DMAIC is an acronym for Define, Measure, Analyze, Improve, Control. One method of starting the “define portion of DMAIC is to use a fishbone diagram. A fishbone diagram is also called a cause and effect diagram or Ishikawa diagram and is a visualization tool for categorizing the potential causes
 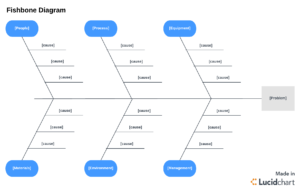 of a problem in order to identify its root causes. John continued to return to this singular idea, we need to identify the “root causes” of the problem.
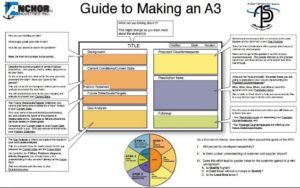 form. The A3 looks at an operational change initiative across nine different areas of documentation. The purpose of the form is to create a record of a change initiative and to ensure that the entire team understands the purpose and scope of the operational change. The nine areas include 1. Reasons for the action – a background statement supplemented with data and objective criteria. 2. Initial state – a description of the current state of the issue referencing specific metrics. 3. Target State – Where do we want the process to improve, again using specific metrics. 4. Gap Analysis – What needs to change to get to the target state. 5. Solution Approach – how we make changes, including a specific list of potential solutions. 6. Rapid Experiments – A list of first pass fast implementation experiments and an analysis of results. 7. Completion plan – Due dates for changes to be implemented. 8. Confirmed State – An analysis of the efficacy of the changes, in theory, it should match number 3 Target State. 9. Insights – What are the fundamental lessons of the event and the improvement cycle. Rick and I discussed how the form can be used, or on occasion misused. Sometimes a process change will lead to a loss in quality, and he made it clear that would lead to backmapping and figuring out a different solution.

 Steve, to ask questions and observe his manufacturing cell during production. I asked Steve what qualities he values most in his production employees. Steve made it clear that a good employee is going to have a technical background, blueprint reading, skills with tools, etc, but the skills he values most are what we traditionally call “soft skills”. He explained that production staff needs to be disciplined, have integrity, and be good listeners. In addition, they need to accept criticism as a path to improvement, not take things personally, and they need to be team oriented and willing to work together to gain efficiency, not to just accept doing things because that is the way they have always been done. As an example, Steve allowed me to watch a young employee, Justin, who was working as an apprentice learning how to run a four spindle machine operation. Justin was working here through his senior year at Pisgah High School in Canton as part of his high school curriculum, and he had recently graduated from Pisgah just two weeks ago. His Metals teacher,
  Watching Justin work it was obvious he was very detail oriented, as multiple parts needed to be adjusted and aligned as part of the milling process. He was meticulous, checking his measurements twice with multiple instruments before resetting the milling process. Mistakes could lead to errors that cost thousands of dollars, not to mention a breach in quality could cost lives. Later in the day, I was able to speak with Cody, one of the original participants in the apprenticeship program. When I asked Cody what he liked most about this work he said: “I really like the problem solving, figuring out how to make things work so that our parts are always top quality”. He went on to say that the work can be stressful, but the organization and process management approach allows for him to “slow down and keep his head” when things start to back up on the floor.
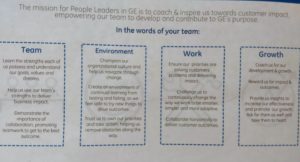 supervisor. Angela shared that machinists are classified as skilled, highly skilled, and advanced. the Advanced Machinists have an Employee Performance Evaluation which provides for observation across 10 categories. You might suspect that this evaluation would be primarily focused on technical aspects, and there are many like “Ability to run multiple machines/processes in and outside area” and “Demonstrates ability to set up parts, modify fixtures, and partner with process engineers”. But in reality, it focuses on a variety of soft skills that help employees bring more value to the shop floor. For example, Standard 1 “Willing to train new and existing employees, shows an interest in their success” and Standard 5 “consistently exhibits desired traits regarding behavior including integrity, honesty, respect, positive attitude, teamwork, dependability, etc”. Standard 6 states “Consistently hits standard and helps others improve performance”, Standard 7 “Owns up to mistakes, brings issues forward, and addresses issues immediately” and “proposes corrective actions and acts to prevent recurring issues”. In standard 8 “recognizes where others need help and offers to jump in” and Standard 9 “Champions ideas for improvements and encourages others to do so as well” and Standard 10 “Embraces teaming”.
 GE Aviation is a leading provider of jet and turboprop engines. They develop and manufacture components and integrated systems for commercial, military, business, and general aviation aircraft. They also have a global service network to support these manufactured engines. GE Aviation recorded revenues of $26 billion and had more than 40,000 employees in 2016.
 About 25,000 jet engines from GE and its partner companies (CFM International and The Engine Alliance) are in airline service today. An aircraft powered by GE or CFM engines takes flight every 2 seconds. Some quick math tells us that about 300,000 people worldwide are flying on GE Aviation or partner engines as you read this sentence. To say they take quality seriously and personally is a massive understatement.
 Composites, is set to revolutionize everything from power generation to aviation and allows engineers to build much more powerful and efficient jet engines. As the company has foreseen the future of advanced manufacturing and invested heavily in 3D printing and digital technology, it has also laid the groundwork for exploiting advanced CMCs’ potential to deliver the increased performance, reduced weight and emissions and lower operating cost being demanded for the jet engines that will power aircraft in the future.